Top City Mobile Air Quality Monitoring Using GIS, GPS, Sensors and Internet
Air pollution is one of the most important factors
affecting the quality of life and the health of urban population.
Air pollution is a serious problem in all urban and semi-urban
areas in India. The air pollution in Chennai is high owing to
fact that due to tremendous increase in use of private, public
and personal vehicles. The Air Pollution has been up by many
folds causing damage to urban public health and properties.
Thus, it has become necessary to monitor the concentration of
Air Pollutants regularly to take appropriate decisions to
mitigate the same. This paper deals with the real time
monitoring of urban air pollutants using solid state gas sensors
with ARM module that connects the measured airpollution
levels to GIS, GPS and Internet so that the pollution levels shall
be known as and when required to deal with any unwarranted
situations.Also the data obtained in this process can be utilized
by Public, Government and Non-governmental organizations to
take appropriate decisionsin order to protect public health and
properties .
I. INTRODUCTION
The effects of air pollution on public health are being felt
worldwide. Pollutants, such as particulates matters (PM10)
and Ozone; primarily resulting from emissions of oxides of
nitrogen (NOx) and hydrocarbons/air toxins (HC or VOCs),
destroy sensitive tissues (in people, animals and plants),
impair respiratory functions, degrade building materials and
deteriorate the aesthetic aspects of environment [1]. India is
facing a serious double burden problem of disease. For the
past couple of years people have been suffering from Dengue,
Chicken guniya and Flu fevers. At the same time, other
chronic non-communicable diseases such as cancer,
cardiovascular disease and respiratory disorders are
becoming more dominant. It is clear that the pattern of
economic growth that adopted by developing countries
increasingly associated with environmental pollution. Indian
cities are also being exposed to high levels of air pollution
and people living in cities are paying a price for the
deterioration in air quality. Air pollution is a serious problem
in thickly populated and industrialized areas in Chennai. The
air pollution in Chennai is abundant, especially in areas
where pollution sources and the human population are
concentrated. Furthermore, though the variety and quantities
of polluting sources have increased dramatically, the
development of a suitable method for monitoring the
pollution causing sources has not followed at the same speed.
Economic growth and industrialization are proceeding at a
rapid pace, accompanied by increasing emissions of air
polluting sources.
Some of the main factors identified as reasons for
increasing vehicular pollution in the Indian mega-cities can
be put together as follows:
High volume of traffic and urban population
dynamics
Excessive increase in private / personal vehicles
Improper maintenance of vehicles
Growing traffic bottlenecks
Less Eco-friendly mode of transport and fuel
technologies
Lack of comprehensive fiscal strategies to check
the increase of private / personal vehicles
Urban environmental management addresses problems
that are spatially distributed as well as dynamic. The two
basic methods or paradigms addressing these dimensions are
data bases and geographical information systems (GIS) on
the one hand, and dynamic simulation models on the other [2].
To prevent or minimize the damage caused by atmospheric
pollution, suitable monitoring systems are urgently needed
that can rapidly and reliably detect and quantify polluting
sources for monitoring by regulating authorities in order to
prevent further deterioration of the current pollution levels.
So as to carry out urban mobile air pollution monitoring over
an extensive area, a combination of ground measurements
through sensors and wireless communication networks and
internet GIS was used for this purpose. This portable device,
comprising solid state gas sensors integrated to a Personal
Digital Assistant (PDA) linked through Bluetooth
communication tools and Global Positioning System (GPS)
allowed rapid dissemination of information on pollution
levels at multiple sites simultaneously. The Air Quality report
generated and published using Internet, GPS and GIS to
provide real-time information to the public and enhanced
public participation
II. NEED FOR THE STUDY
In India, the number of motor vehicles has increased from
0.3 million in 1951 to 115 million in 2010. The number of
two wheelers registered has increased from 38.56 million in
2001 to 82.40 million in 2010 registering an increase of 114%
over the period, while the number of Light Motor Vehicles
(passengers) and Jeeps showed an impressive growth of 78%
and 46% respectively during the same period. The total
number of cars registered has increased from 5.30 million in
2001 to 12.37 million in 2010 which show a growth of 133%
during the period. In Chennai, Motor vehicle population has
increased at a phenomenal rate as an average 9.7% for the last
few decades from 87,000 (1984) to 20,38,875 (2008) [4].
Vehicular emissions are of particular concern since these are
ground level sources and thus have the maximum impact on
the general population. Also, vehicles contribute significantly
to the total air pollution load in many urban areas. Under the
National Ambient Air Quality Monitoring (NAAQM)
network, four air pollutants, namely SPM, CO, SO2 and NO2
have been identified for regular monitoring at all the 290
stations spread across the country. Out of which the entire
Chennai city has got only 6 ambient air quality monitoring
stations [5]. With this limited number of stations, to
represent the air quality in Chennai city spatially is difficult
task. Hence there is need for a co-ordinated methodology to
monitor air quality continuously and made available the same
data in real time for decision makers and public as well in
order to take necessary steps for mitigating pollution.
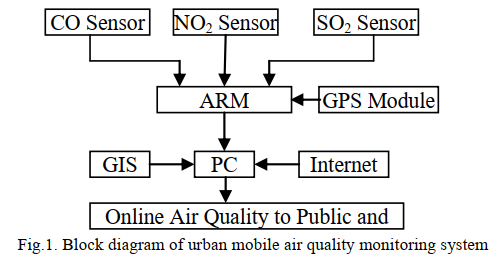
III. METHODOLOGY
In this study, three solid state gas sensors were used to
measure three gases namely CO, NO2 and SO2 are linked
with GPS through ARM processor [3]. The Chennai city map
was digitized with GIS and GPS by moving around the city
then the digitized map was fed into the internet. ARM
Processor is a type of processor which is used to link different
types of outputs. It also helps in uploading the linked data to
the internet. This ARM Processor and outputs devices are
collectively known as ARM Module. The above said three
sensors and GPS are linked through ARM module, then it is
fed into the server through laptop and then it is uploaded to
the internet. The Pollution data can be viewed through the
web page (www.airpollutioninfo.com). Hence the public can
view the level of pollution in a particular place in Chennai
using the website. Fig.1 shows the block diagram of the
working method of urban mobile air quality monitoring
system using Gas Sensors, GPS, GIS and Internet.
In this study, three important routes in Chennai were
selected based on the volume of traffic that will generate high
emission from the vehicles. Route 1: Avadi to Tambaram
(this route covers some of the important, official and
commercial areas of the city like Ambatur, Dunlop,
Koyembedu, Vadapalani, Udayam, Airport, etc,.) Route 2:
Kovalam to T. Nagar (This route covers tourists places like
MGM, VGP, KOVALAM, MAYAJAL etc,.) and Route 3:
vadi to Chennai Central (this route covers all type land
uses namely Industrial, Educational, Residential, Official and
Recreational the areas covered are Ambatur, Annanagar,
Kilpauk and Chennai Central). These three routes on which
the air quality data collected is presented in Fig.2 and Arc
View GIS is used for this purpose [7]. The gas sensors and
GPS are fitted in car and same connected to a car battery for
power supply. The GPS unit and gas sensors are further
connected to ARM processor. The air pollution monitoring
survey is carried in the above said three routes in the
afternoon session the starting and ending time of survey was
kept same inorder to get same pattern of data.


Leave a Reply